Log
Ratio, starter temperature and the time you fed, saved in this browser and emailed to you when you ask.

Sourdough · Calculator
Log a feed, see when your starter should peak, record when it actually did, and the timing becomes your own.
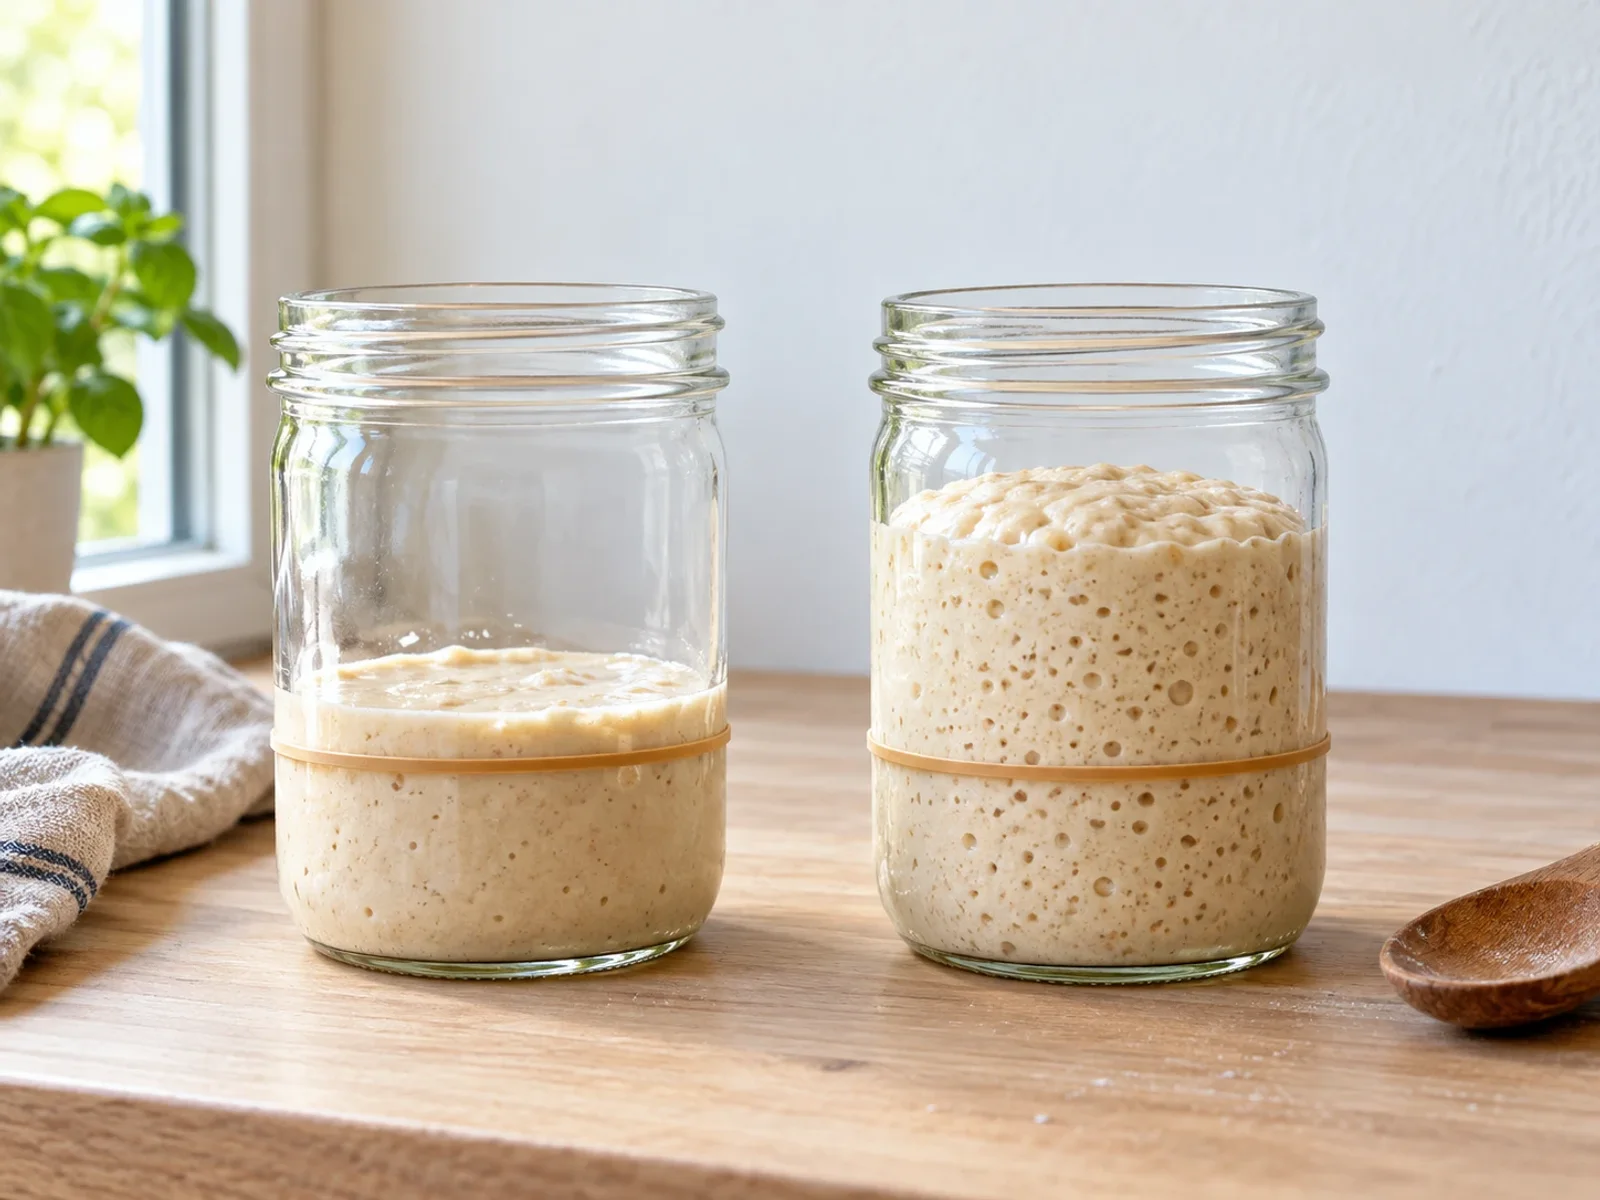
Starter tracking guide
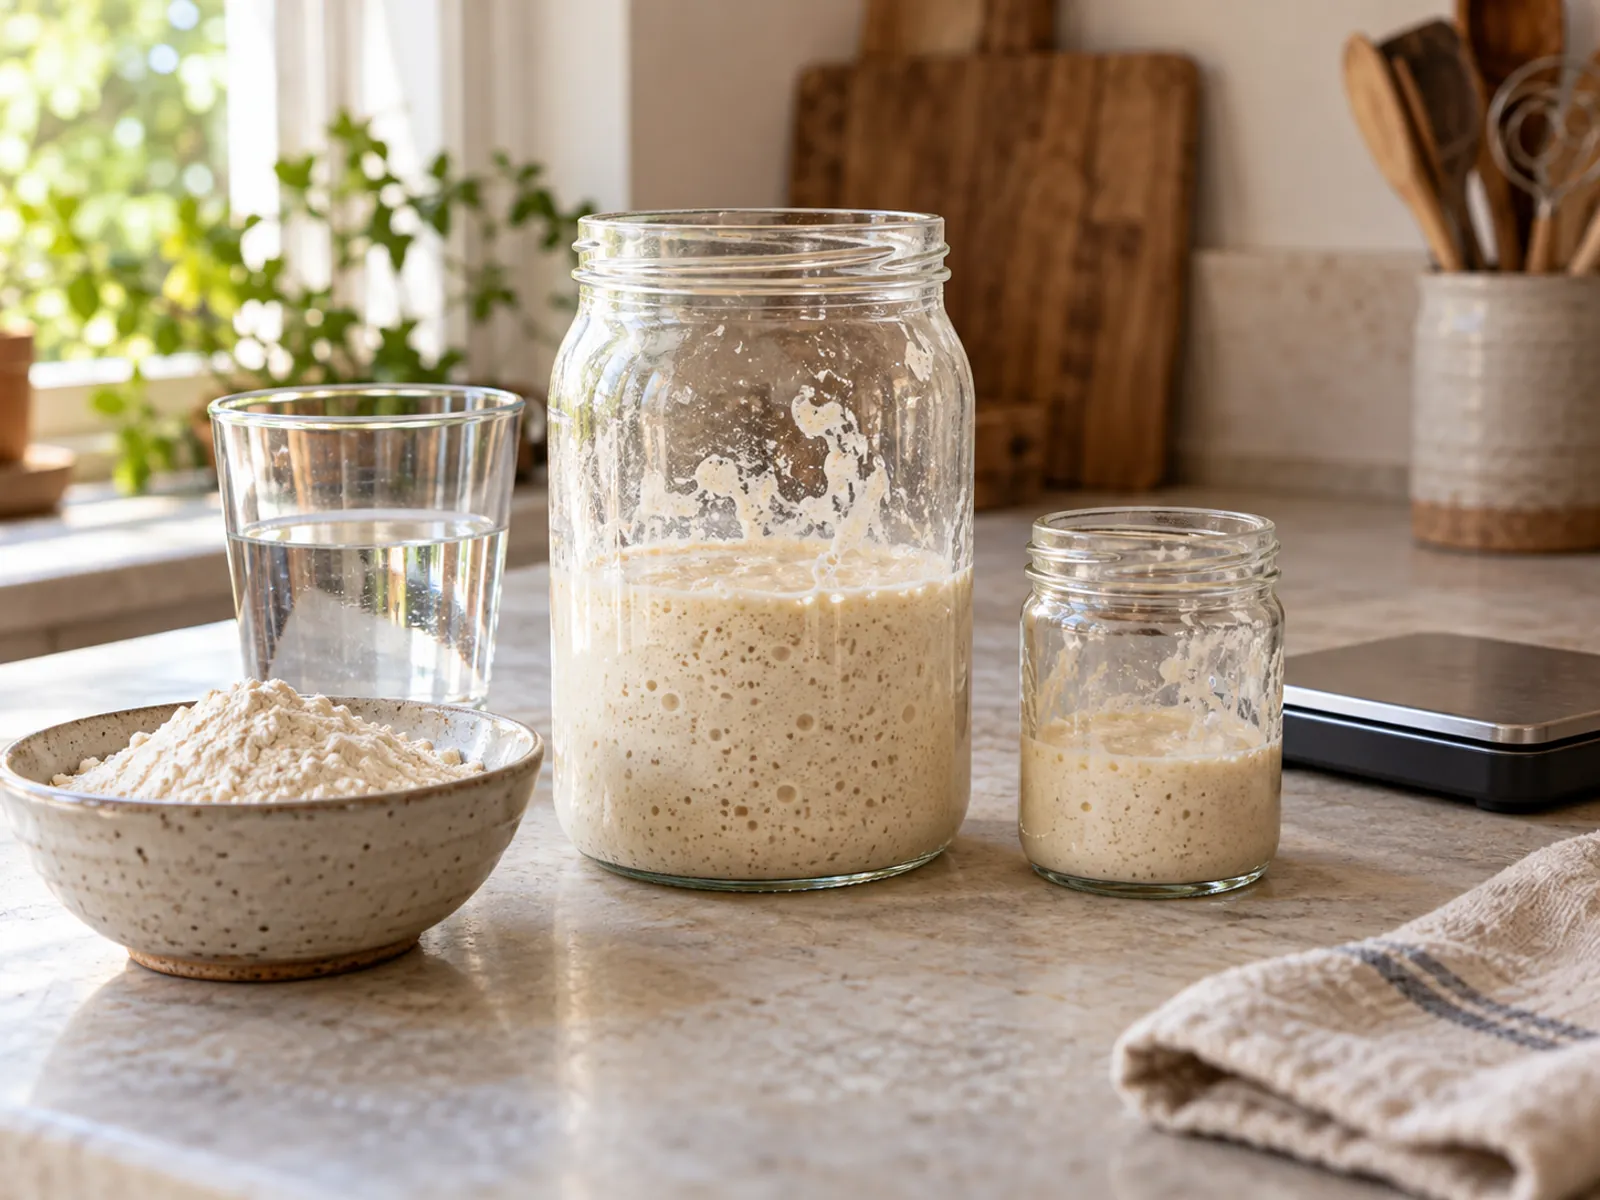
Every starter keeps its own clock. Log your feeds and peaks here and the expected time moves from our general estimate to your jar’s real timing.
Ratio, starter temperature and the time you fed, saved in this browser and emailed to you when you ask.
Where the rise should be now, and when to check the jar.
After two recorded peaks, the expected time is your starter’s own.
your median, else the tableUntil you have two recorded peaks at a ratio, the window comes from our starter timing table at your starter temperature. After that, it is the median of your own peaks.
The chart’s curve is an illustration of that sequence, scaled to your expected peak. The real shape depends on flour, hydration and the jar, which is why the points you record matter more than the line.
Planning estimates for an established, healthy 100% hydration wheat starter, not one in its first two weeks. The 1:1:1 and 1:2:2 rows bracket what King Arthur Baking saw at about 78°F, checking every 4 hours; the other cells are our extrapolations. Doubling, the highest point and the first fall are separate moments, and your own starter will vary, so mark the jar and learn its timing. The source behind our table is King Arthur Baking, sourdough feeding ratio comparison (2025).
Two starters fed the same ratio in the same kitchen can peak hours apart. Recording a few feeds at a steady temperature tells you more about your jar than any chart, and it makes bake-day planning simple: feed at the time that puts the peak where you need it.
FAQ
How the expected peak is worked out, where your feeds are kept and how to keep a copy.
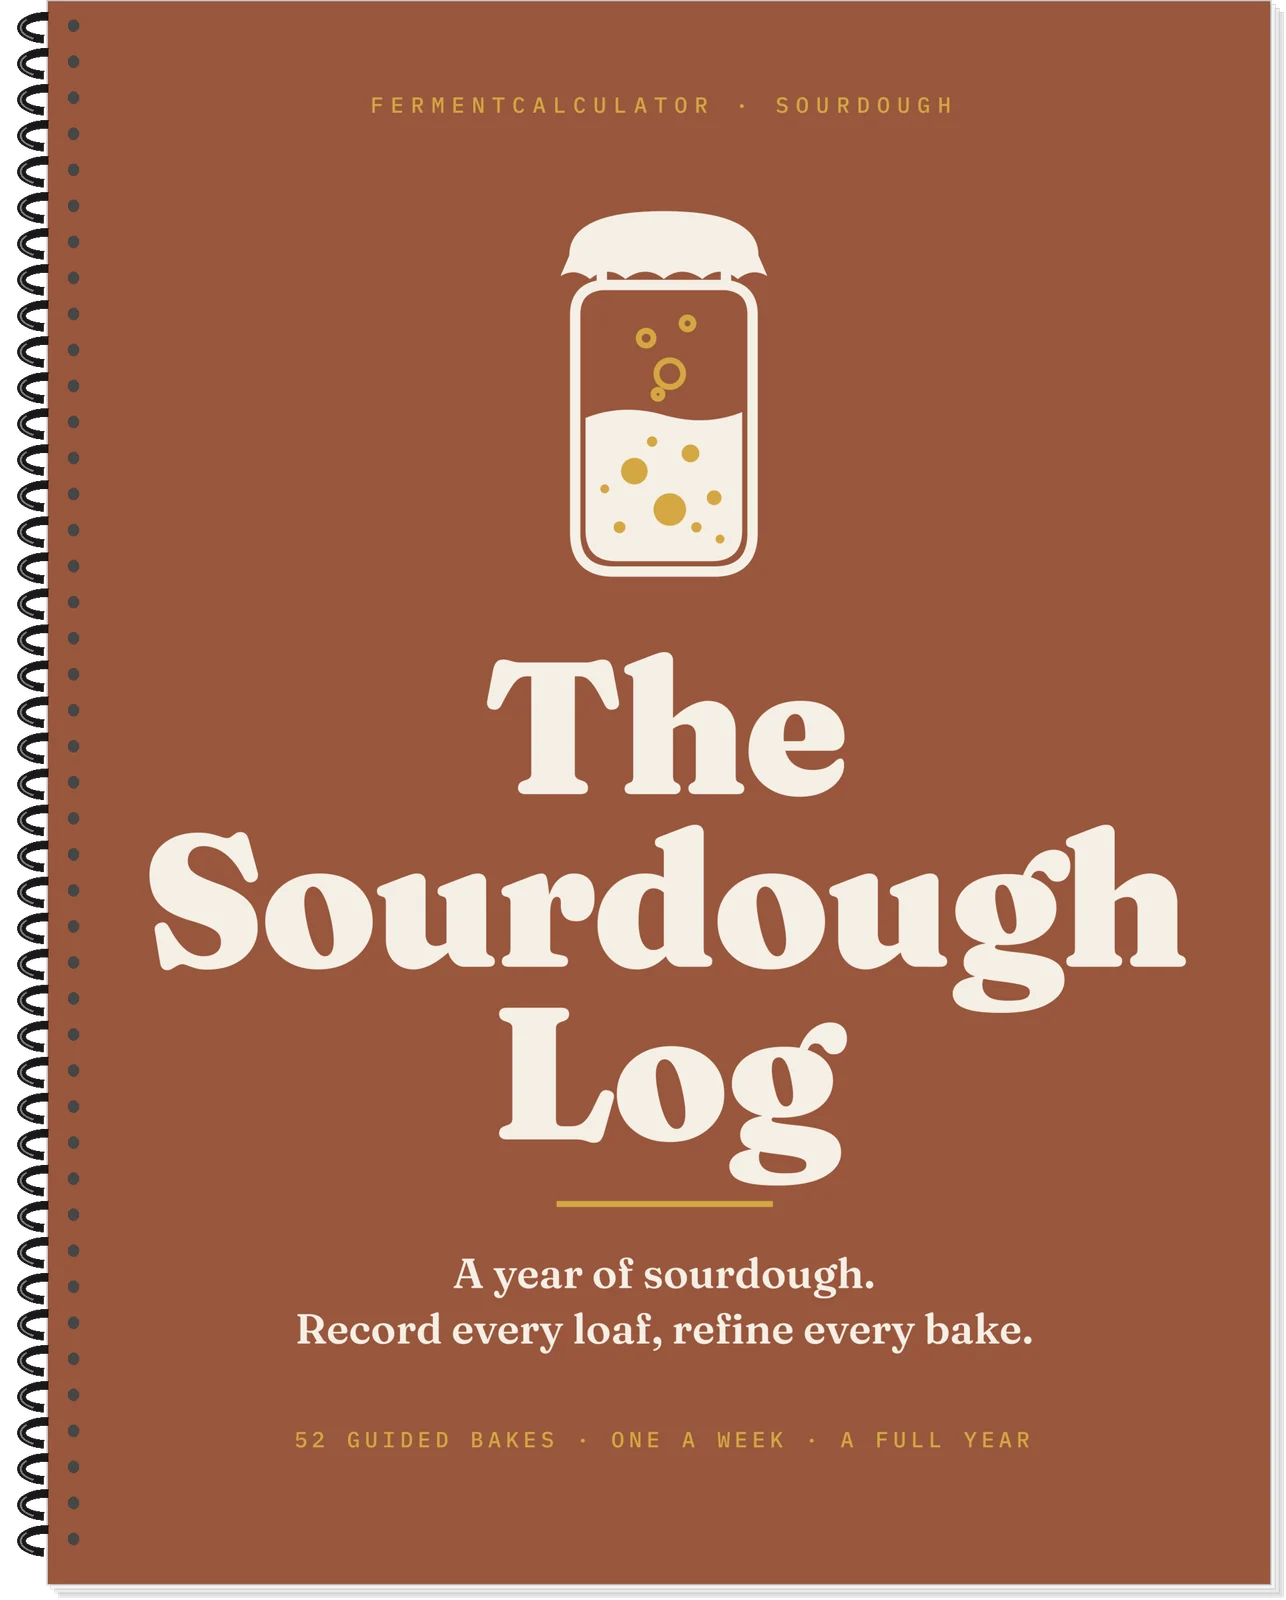
Printed book · Delivered to you
A spiral-bound book delivered to your door, ready to write in. 52 bake records in a spiral-bound journal that lies flat.
Digital download · Print at home
Download the files and print your own copy. No book is shipped. 52 guided bake spreads to download and print at home.
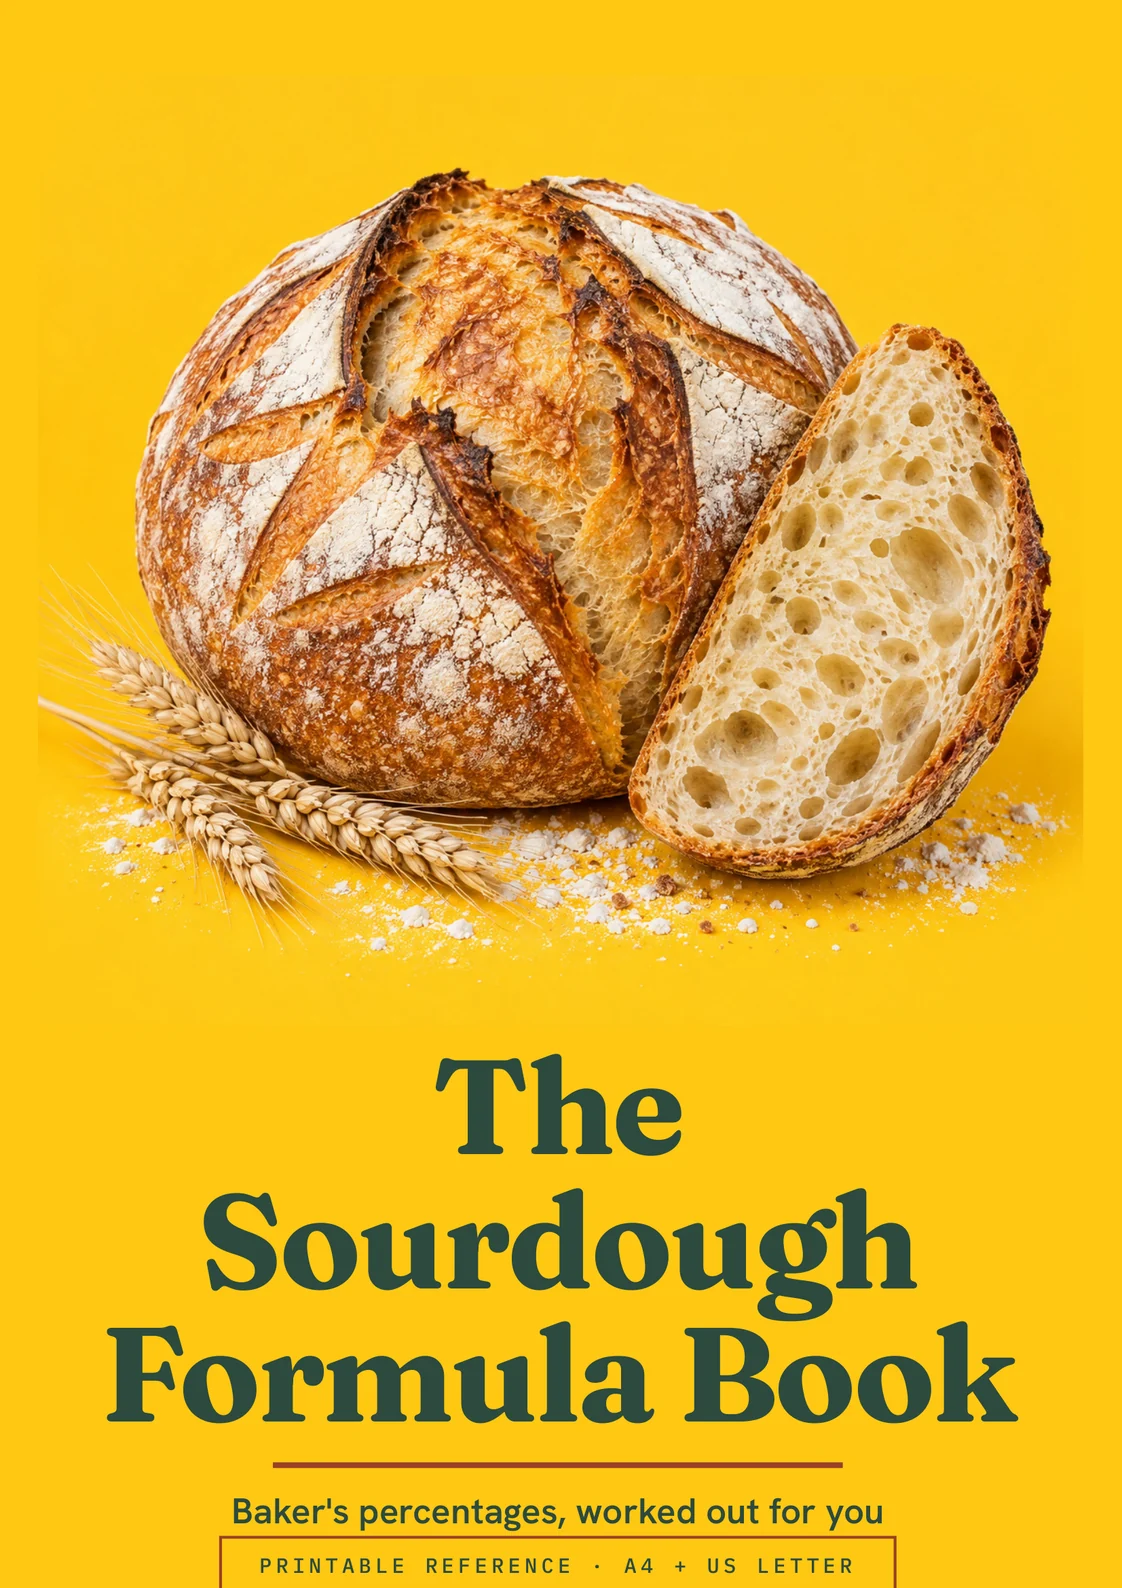
Digital download · Print at home
Download the files and print your own copy. No book is shipped. Baker's percentages, worked out for you.
Get the complete Sourdough Baking Playbook — starter ratios, hydration, levain builds, bulk timing and discard in one printable reference.
Calculators and guides for your next step.